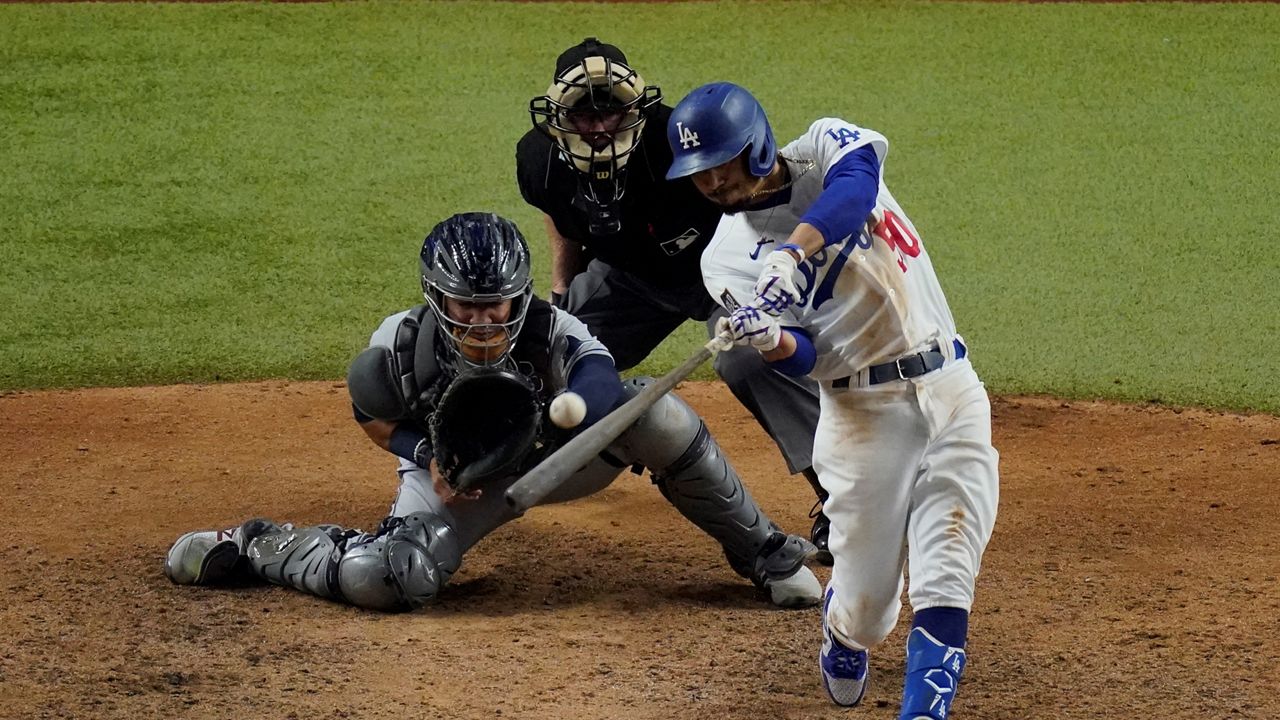
ORANGE COUNTY, Calif. — Mookie Betts passes the eye test. He's got fast hands in the batters' box, hunts fly balls in the field, and each movement on the baseball diamond is an agile one; his arms and shoulders nearly always perfectly balanced over his legs. And in any conversation about the best player in the league, Betts's name pops up.
The numbers offer evidence, too, including a new statistic developed by UC Irvine professor Michael McBride.
When the Los Angeles Dodgers won the World Series, McBride saw Betts as the clear favorite for the Most Valuable Player Award, not the eventual winner, shortstop Corey Seager.
When it came down to who helped win more games, McBride's conclusion was the Dodgers' right fielder.
"The emphasis has been on getting better and better at estimating a player's skill," McBride said. "My measure is breaking with that trend.""The emphasis has been on getting better and better at estimating a player's skill," McBride said. "My measure is breaking with that trend."
McBride has attempted to quantify which players directly contribute to winning and how much their individual efforts contribute to the wins column.
A professor of economics, McBride calculates each event in a given inning from hits to fly balls to walks. But the complexity of his measure comes, in part, from the collection of the data — which is largely available in play-by-play descriptions. There's no perfectly organized sheet of numbers for him to peruse. He assigns specific values to achievements in particular situations. A batter who knocks in a run would earn less credit than a batter who knocks in a run that allows the team to take the lead. In the case of Betts, McBride said most of his production came in wins while Seager's came in losses. Ultimately, McBride hopes to show which players contribute game-winning actions the most often.
To calculate the data he collects, he turned to Nobel Prize-winning economist Lloyd Shapley. Applying the Shapely Value, used by some corporations to assign credit, McBride narrows in on who the best players are.
He's hoping it catches on at the major league level. Thus far, he's submitted a paper to Baseball Prospectus, a significant publication in baseball analytics.
The field was introduced to popular culture in the 2011 film Moneyball starring Brad Pitt. It chronicles the ascendance of Oakland Athletics general manager Billy Beane, a once gifted baseball prospect who never materialized as a major league star.
For much of baseball's history, talent was evaluated by old pros who eyed a player's bat speed, throwing motion, or how fast he could run. The book that inspired the film, also called Moneyball, even suggests some talent evaluators looked for players with "a good face."
Such deep dives into numbers were popularized by Beane, the main figure in the book and film, to make the most of a limited budget.
He helped popularize a new way of evaluating talent that reassesses what qualities baseball teams should value. Teams began valuing walks more and pitchers who had high percentages of ground-ball outs.
But sabermetrics can quickly become complex. One of the more popular measures cited by baseball writers is Wins Above Replacement or WAR. It aims to show how much better a given player is than a replacement-level player. The somewhat nebulous parameters of the measure mean that different outlets have different ways of calculating WAR.
Even hard data can be open to interpretation.
The field has steadily grown as numbers influenced decision-makers have achieved more and more success. While Beane popularized the use of numbers among baseball executives, his teams have never won a championship. Perhaps the more consequential steward of sabermetrics has been Theo Epstein, who broke two of the longest championship droughts in baseball history as general manager of the Boston Red Sox and Chicago Cubs.
Still, the field is expanding.
Arizona State University is host to the Society of American Baseball Research or SABR, a nonprofit with a voluminous publishing schedule and 32 special research committees.
"There's a lot more work to be done in terms of understanding why players are as good as they are and why they're able to achieve the levels they do," said Scott Bush, CEO of SABR.
Teams offer a lot of statistics that have now become basic fare for number crunchers. And even those existing numbers are valued differently than they once were. Batting Average used to reign along with On Base Percentage. Now, on-base plus slugging or OPS, a combination of the two, is considered more illuminating.
Now the game has charted course into new realms of number crunching hidden in proprietary systems locked in team computers.
"It's definitely getting more and more into black box territory where it used to be, 'Look, you have access to the same numbers that I do. This is what I've done with them,'" he said.
But not every measure is adopted, and McBride's has yet to catch on. So far, he's calculated about 30 world series and has long-term plans to continue building evidence for his system. Bush said baseball front offices that do see McBride's paper will have someone on staff with the credentials to critique it.
"You're going to have to prove how you got to your conclusions, and there's going to be someone sitting on the other side of the table who's qualified to judge your work," he said.


