
SAN DIEGO — A group of scientists from the Scripps Institution of Oceanography at the University of California San Diego have been keeping track of beach erosion along San Diego’s coast with the help of lasers.
Adam Young is a coastal geomorphologist and researcher at UC San Diego’s Scripps Institution of Oceanography. He spends a lot of time on the beach. You might even call it his office.
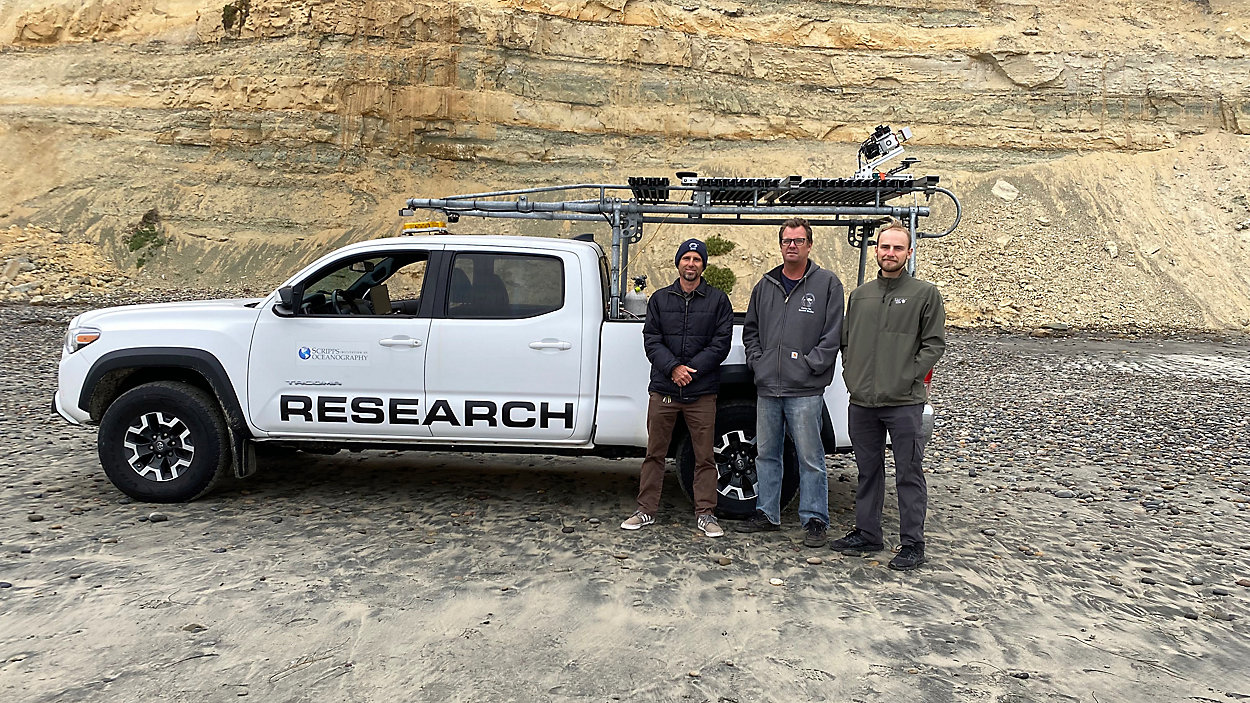
Young has been doing research on and surfing at the beach since the 1990s. He studies coastal erosion, overseeing coastline surveys throughout the state. Young and his team use a tool called a LiDar scanner to do their work.
“It stands for light detection and ranging. And essentially, it’s sending out high frequency laser pulses,” he said.
But you can’t actually see the lasers. Young explained that they attach the scanners to trucks and drive along coastlines. As they drive, the LiDar scanner is sending out pulses.
“Each laser pulse is bouncing off the surface of the beach or cliff,” he said.
One of the cliffs can be found along Torrey Pines State Beach in La Jolla. As the pulses bounce back to the LiDar, it’s essentially measuring the time it takes to return to the scanner. From that data, the scientists can figure out how far away the surface is. Each time they do beach surveys, they’re collecting millions of data points every few seconds.
"Depending on how many times you pass the cliff with the laser, you get on the order of a point every few centimeters on the cliff and on the beach," said Young.
The data helps create high-resolution, three-dimensional maps. Doing the surveys several times a week — depending on when the low tides are around to give them enough sand to drive on the beach — they can compare the maps and look for change. Young says they can see really tiny changes.
“Something like the size of a softball moves, we can see it," he said.
It’s the type of detail Lesley Ewing, senior coastal engineer at the California Coastal Commission, says wasn’t available back in the day.
“What we’ve been doing historically is getting shots of the coastal bluffs every five, 10, 15 years,” Ewing said. “We would do it with photographs.”
The photos were taken from airplanes, which Ewing says is expensive. It also left people like her, who use data to help provide guidance for coastal infrastructure projects, with lots of questions.
Ewing explained that by using her hands to show movement of a coastal cliff, "you know, here’s the bluff. Then you go back five years later, and it’s here. Well, you don’t know what happened."
Ewing says the maps Young and his team are creating will be game-changers.
“More and more, as we talk about concerns with rising sea level, we’re talking about ways to adapt to sea level rise,” she said.
Helping coastal communities plan for the future is the reason Young says his team is doing this work, "as well as help identify potentially hazardous areas and improve safety along our coastlines," including information about landslides.
Plus, the surfer-scientist says he can’t help but do this work.
“I think all surfers sort of have a passion for the ocean and understanding the environment,” he said.
Though staring at these bluffs from the lineup now, Young says he can’t quiet his mind while surfing because of all the questions he hopes to answer.
Team member and marine technician Lucian Parry says the beach surveys are typically two hours and cover anywhere frrom a one-to-five-mile stretch, roughly. Twice a year, the team also covers a longer stretch of beach from La Jolla Shores to Oceanside over a four-to-five-day period.
Young says the goal is to have these maps available on a website. The team has been collecting data since 2017.
You can see and read more about this research here.